Universities need more than access to institutional data; they need the ability to turn that data into decisions that improve performance. When leadership can clearly track student retention, academic progression, enrolment, financial health, and faculty capacity, it becomes easier to identify gaps, allocate resources, and address challenges before they affect institutional outcomes.
A well-structured reporting framework helps university leaders move from reactive problem-solving to proactive management. It brings greater visibility into what is working, where performance is declining, and which areas require immediate attention. Instead of waiting for end-of-semester reviews or manually consolidating departmental spreadsheets, decision-makers can work with consistent, timely information.
The result is a more accountable and responsive institution: student support can be directed towards those who need it, academic programmes can be evaluated using measurable outcomes, financial risks can be identified earlier, and strategic priorities can be monitored against actual performance.
University leaders need different types of reports to understand institutional performance, from student success and academic quality to financial health and operational efficiency. The following 12 reports provide a practical starting point for building a more informed, data-driven approach to university management.
A student retention and attrition report helps universities understand how many students continue their studies, withdraw, or discontinue their programmes over a defined period. It can track retention rates by academic year, semester, programme, department, campus, and student cohort.
Beyond measuring the number of students who leave, this report can help identify patterns behind attrition. For example, leadership may notice that withdrawals are concentrated in a particular semester, programme, or student group. By examining these patterns alongside attendance, academic performance, and outstanding fees, institutions can investigate potential causes and plan timely interventions.
Outcome: Earlier identification of at-risk students and more targeted student retention initiatives.
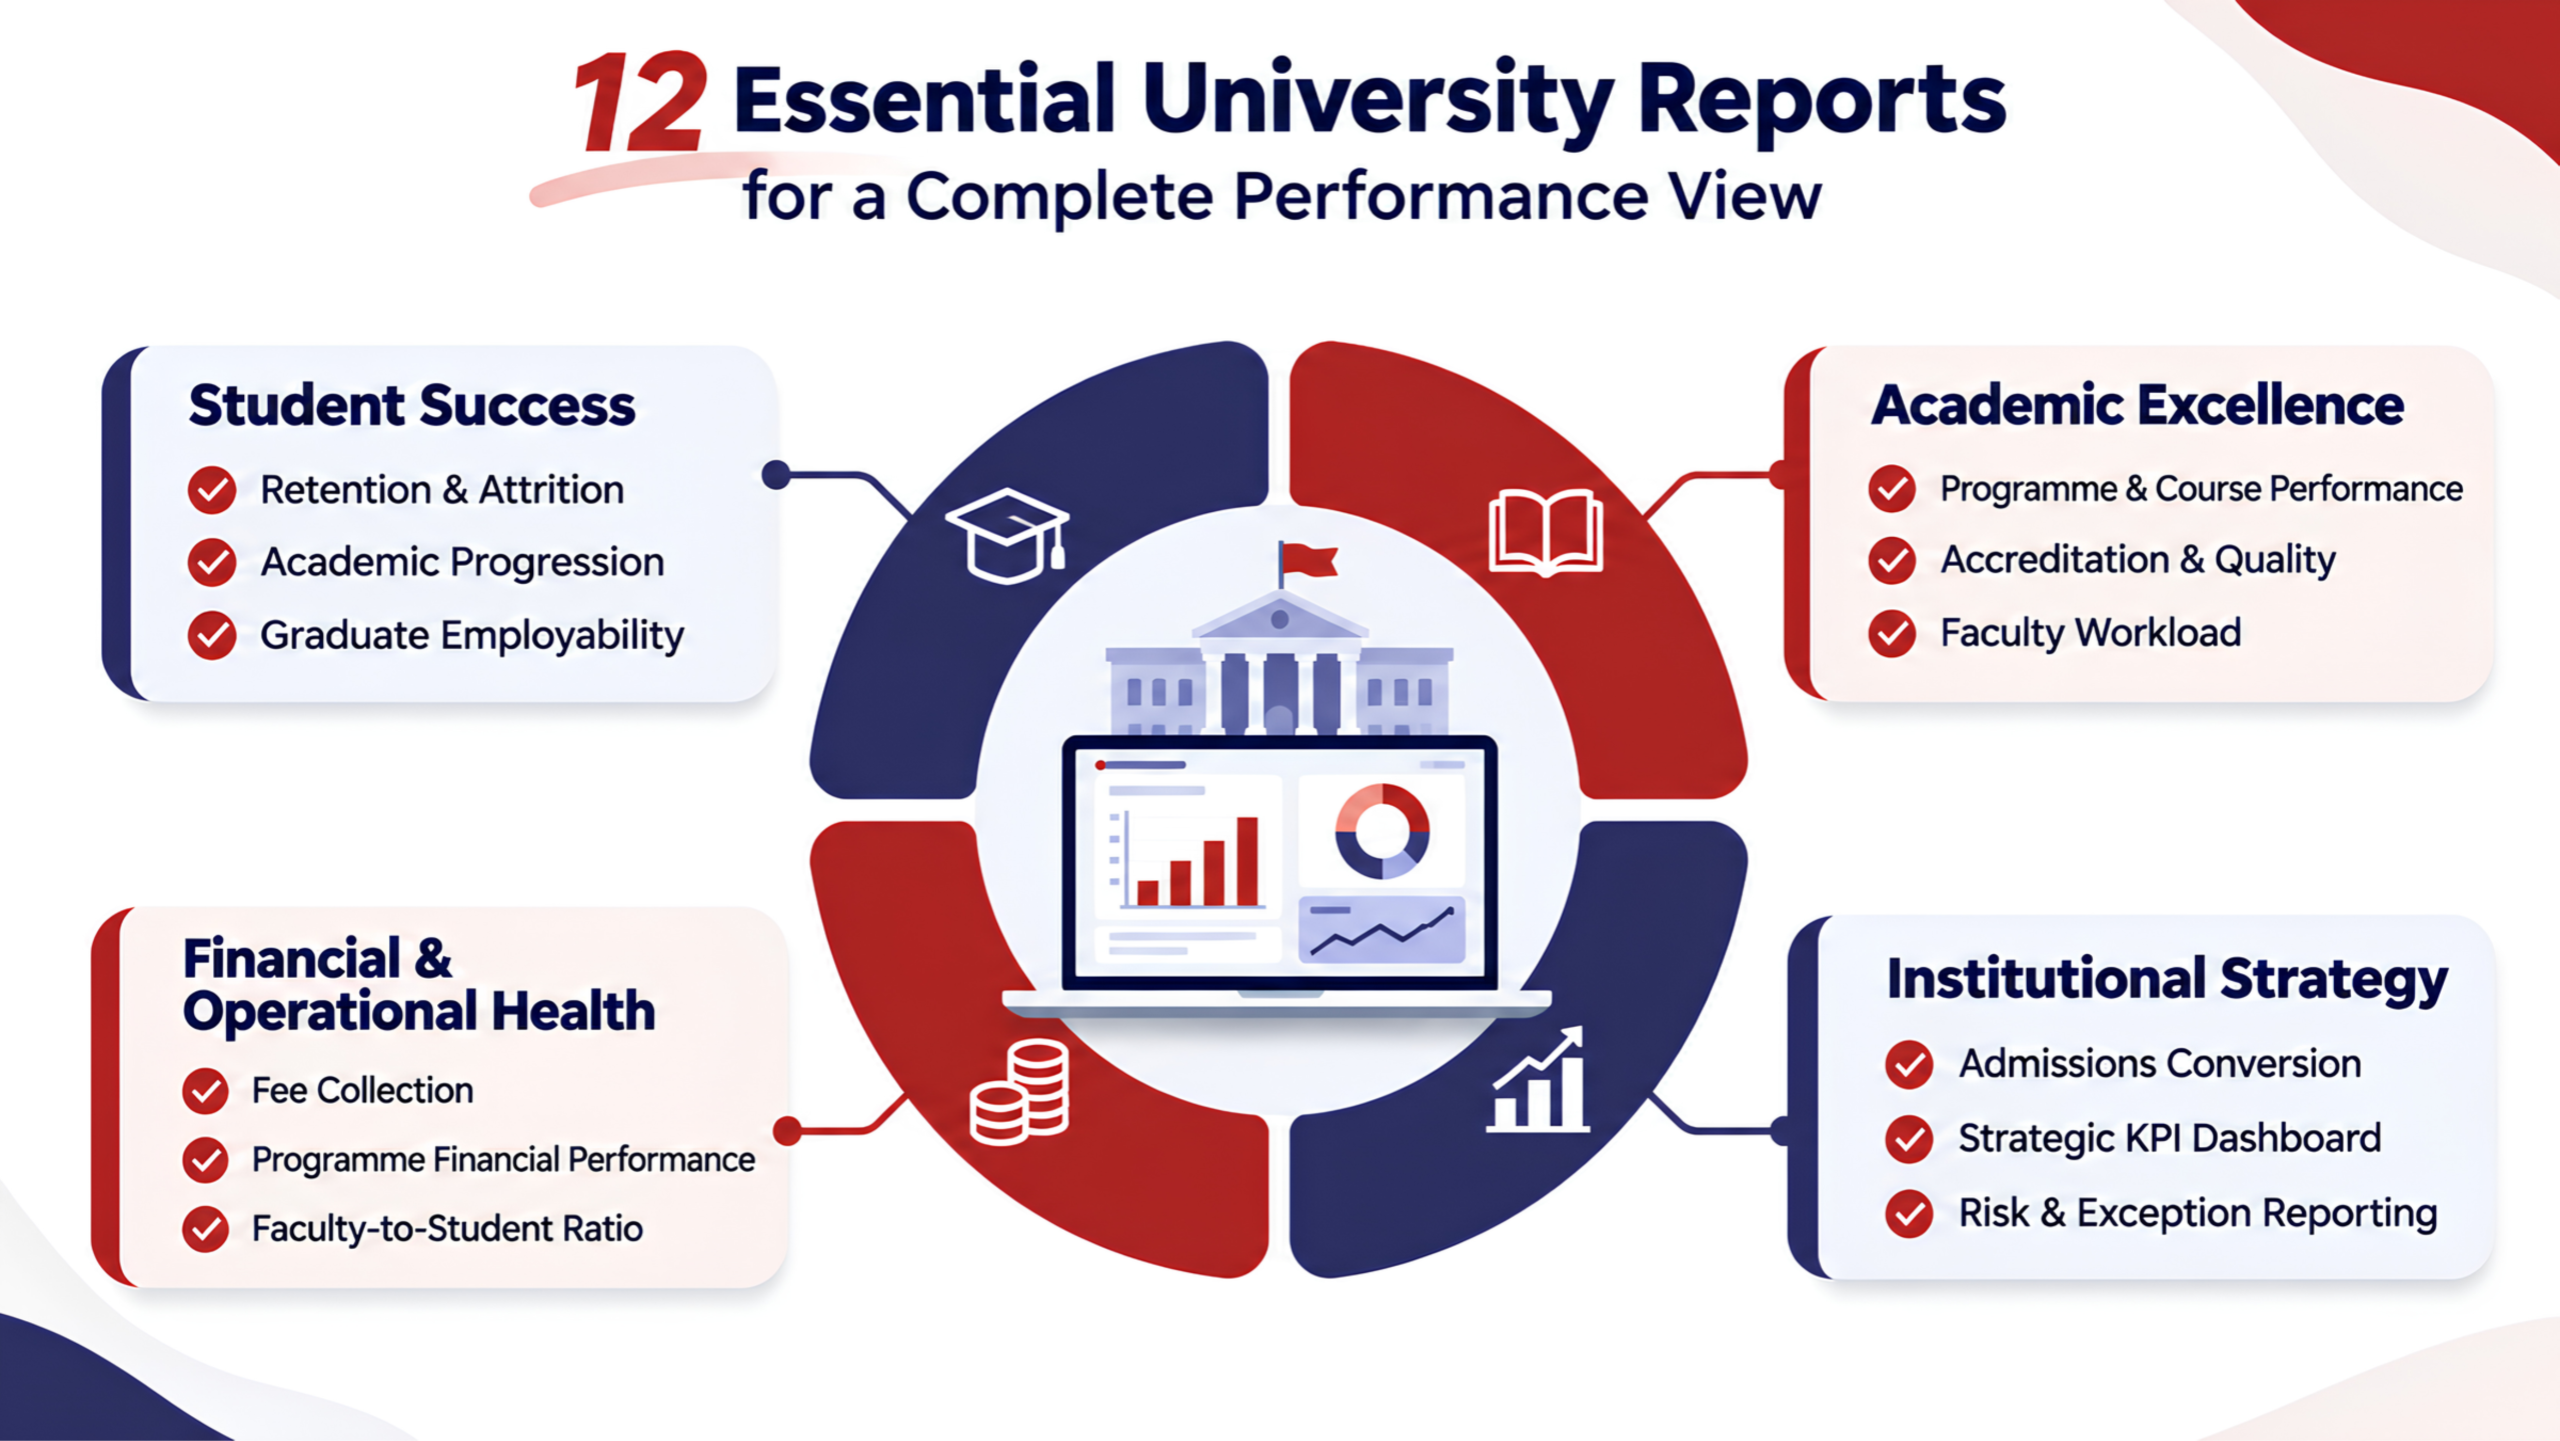
This report provides visibility into how students progress through their academic programmes. It tracks completed credits, examination results, backlogs, course completion, graduation eligibility, and time taken to complete a qualification.
The information helps academic leaders identify where students are experiencing delays and whether particular courses or programme requirements are affecting progression. The OECD’s Education at a Glance 2025 highlights the importance of monitoring completion timelines, reporting that 43% of new bachelor’s students across OECD countries and partner economies graduate within the programme’s theoretical duration.
Universities can use progression data to review academic support mechanisms, assess curriculum requirements and identify students who may need additional guidance to complete their programmes on time.
Outcome: Better monitoring of academic progress, improved completion planning and more informed decisions about academic support.
A programme and course performance report brings together information such as pass rates, examination results, assessment outcomes, course completion and student performance across different academic terms.
By comparing results across departments, courses, and semesters, academic leaders can identify subjects with consistently low pass rates, variations in assessment outcomes, or programmes that may require curriculum review. It also provides a basis for evaluating whether teaching and learning interventions are producing the expected improvements.
This report can support discussions between department heads, faculty members, and academic committees by giving them a shared view of programme performance rather than relying on isolated departmental updates.
Outcome: More evidence-based curriculum reviews and targeted improvements in teaching and learning.
Universities need to understand what happens after students complete their education. A graduate employability and placement report can track placement rates, employment status, time to employment, sector-wise distribution, and the relevance of graduates’ roles to their qualifications.
When this information is collected consistently, institutions can evaluate how effectively their programmes prepare students for the employment market. It can also help identify differences in outcomes across programmes and graduating batches.
For university leadership, these insights can inform curriculum development, industry partnerships, career services, and programme-level reviews. Institutions can also use graduate feedback and employer input to understand where additional skills development may be required.
Outcome: Better visibility into graduate outcomes and stronger alignment between academic programmes and employment needs.
An enrolment and admissions conversion report tracks the journey from application to confirmed admission. It can include applications received, offers issued, accepted offers, completed enrolments and conversion rates across programmes, intake periods and recruitment channels.
The report helps admissions teams identify where prospective students are dropping out of the process. For example, a high number of applications but fewer confirmed enrolments may indicate delays, incomplete documentation, communication gaps or challenges during the admission process.
By reviewing these stages, institutions can assess recruitment performance, improve follow-up processes and make better-informed decisions about admission planning and student recruitment priorities.
Outcome: Improved admissions visibility, more effective recruitment planning and fewer missed enrolment opportunities.
Accreditation and quality assurance reports help universities monitor the academic and institutional information required for internal reviews, regulatory reporting and external accreditation processes. Depending on institutional requirements, these reports may include programme outcomes, faculty qualifications, assessment results, student feedback and quality indicators.
Maintaining this information in a structured format makes it easier for institutions to review performance against defined standards and identify documentation gaps before an evaluation or accreditation exercise. It also supports more consistent reporting across departments and academic programmes.
Rather than collecting information only when an accreditation deadline approaches, institutions can use regular reporting to maintain visibility into quality indicators throughout the academic year.
Outcome: Better preparedness for accreditation reviews and more consistent monitoring of academic quality.
A fee collection report gives finance teams and university leadership a clear view of fee payments, outstanding balances, overdue accounts, payment trends, and collections across programmes or student categories.
It helps institutions understand where payment delays are occurring and how outstanding receivables may affect cash flow. Leadership can review collection patterns across academic terms, identify recurring delays, and evaluate whether payment schedules or communication processes need attention.
When fee information is connected with student records, authorised teams can also access relevant financial information without repeatedly reconciling data across separate systems.
Outcome: Greater financial visibility, better receivables monitoring and more timely follow-up on outstanding payments.
A programme-wise financial performance report helps university management evaluate the financial position of individual academic programmes. It can bring together information on enrolment, fee revenue, operational expenditure and resource utilisation, depending on the financial data available to the institution.
This allows leadership to compare programme-level performance and understand how changes in enrolment or costs may affect financial sustainability. It can also support decisions about resource allocation, programme expansion and long-term academic planning.
The report should be interpreted alongside academic quality, student demand and institutional priorities. Financial performance alone should not determine the value or continuation of an academic programme.
Outcome: More informed resource allocation and stronger programme-level financial planning.
Faculty workload reports provide visibility into teaching hours, course allocations, academic responsibilities, and workload distribution across departments. They help academic administrators understand how teaching responsibilities are assigned and whether workloads are balanced.
The report can highlight departments with concentrated teaching demands, faculty members handling multiple courses, or areas where additional academic resources may be required. It can also support workload planning before a new academic term begins.
By reviewing this information regularly, institutions can make staffing decisions based on actual academic requirements and avoid relying solely on manual workload calculations.
Outcome: More balanced faculty allocation and better academic resource planning.
This report compares student enrolment with available faculty strength across programmes, departments, and campuses. It helps institutions assess whether their current academic capacity is aligned with student numbers and programme requirements.
Tracking this ratio over multiple academic terms can reveal where enrolment growth is putting pressure on teaching resources. It can also help leadership identify departments that may require additional faculty, revised class allocation, or changes to academic capacity planning.
The report becomes particularly useful during admission planning, programme expansion, and institutional reviews, when leadership needs to understand whether available resources can support projected student numbers.
Outcome: Better visibility into academic capacity and more informed faculty recruitment and expansion decisions.
An institutional KPI dashboard brings key performance indicators into one view, allowing university leadership to monitor progress against strategic objectives. Depending on institutional priorities, it may include enrolment, retention, graduation, employability, financial performance, academic quality, and operational indicators.
Instead of reviewing each department’s performance in isolation, leadership can compare results across institutional priorities and identify areas where progress is on track or falling behind. Consistent KPI definitions are essential so that different departments measure and report performance in comparable ways.
A well-designed dashboard should also allow authorised users to move from high-level indicators to the underlying information needed to understand performance changes.
Outcome: Clearer strategic oversight, stronger accountability and more consistent performance reviews.
An institutional risk and exception report helps universities identify unusual patterns or performance indicators that require attention. Examples may include declining attendance, increasing academic backlogs, overdue fees, lower retention, missed departmental targets, or delays in key administrative processes.
Instead of requiring leaders to review every record manually, exception-based reporting highlights areas that fall outside defined thresholds or expected patterns. This helps the relevant teams investigate issues and prioritise corrective action.
Outcome: Earlier visibility into emerging institutional challenges and a more proactive approach to risk management.
Manual reporting can consume significant institutional resources, particularly when teams must collect information from multiple departments, reconcile spreadsheets, and respond to repeated data requests.
Research from the Education Advisory Board (EAB), in its Activating the Analytical Mandate study, illustrates the scale of this challenge. The study found that 25%–100% of decision-support team capacity at the institutions examined was being used to respond to ad hoc data requests. One research university reported spending 3,500 hours over 12 months on such requests, while typical unit-level requests could face backlogs of three to six weeks.
These findings are specific to the institutions examined, but they highlight a wider management challenge: when reporting depends heavily on manual data collection, the time available for analysis and strategic support can become limited.
From Academia by Serosoft’s perspective, reporting automation should be treated as an institutional productivity priority rather than simply an IT improvement. Universities can begin by standardising recurring academic, administrative and financial reports, establishing consistent KPI definitions, providing role-based dashboard access and using exception-based reporting to highlight issues that require attention. This enables teams to spend less time preparing reports and more time analysing insights to improve institutional performance.
Having a large volume of institutional data does not automatically lead to better decisions. When admissions, academics, finance, and student services operate with disconnected information, leadership may struggle to establish a complete picture of institutional performance.
The EDUCAUSE 2024 Analytics QuickPoll identifies data silos, data quality and system integration challenges, as well as limited analytics expertise and data literacy, among the barriers to wider analytics adoption. These findings underline why institutions need to focus not only on collecting data but also on making it consistent, connected and usable.
Consider an annual performance review. Admissions data may show an increase in enrolment, while academic records indicate declining progression and finance reports show rising outstanding fees. If these datasets cannot be viewed together, leadership may find it difficult to understand the relationship between these trends and determine where intervention is needed.
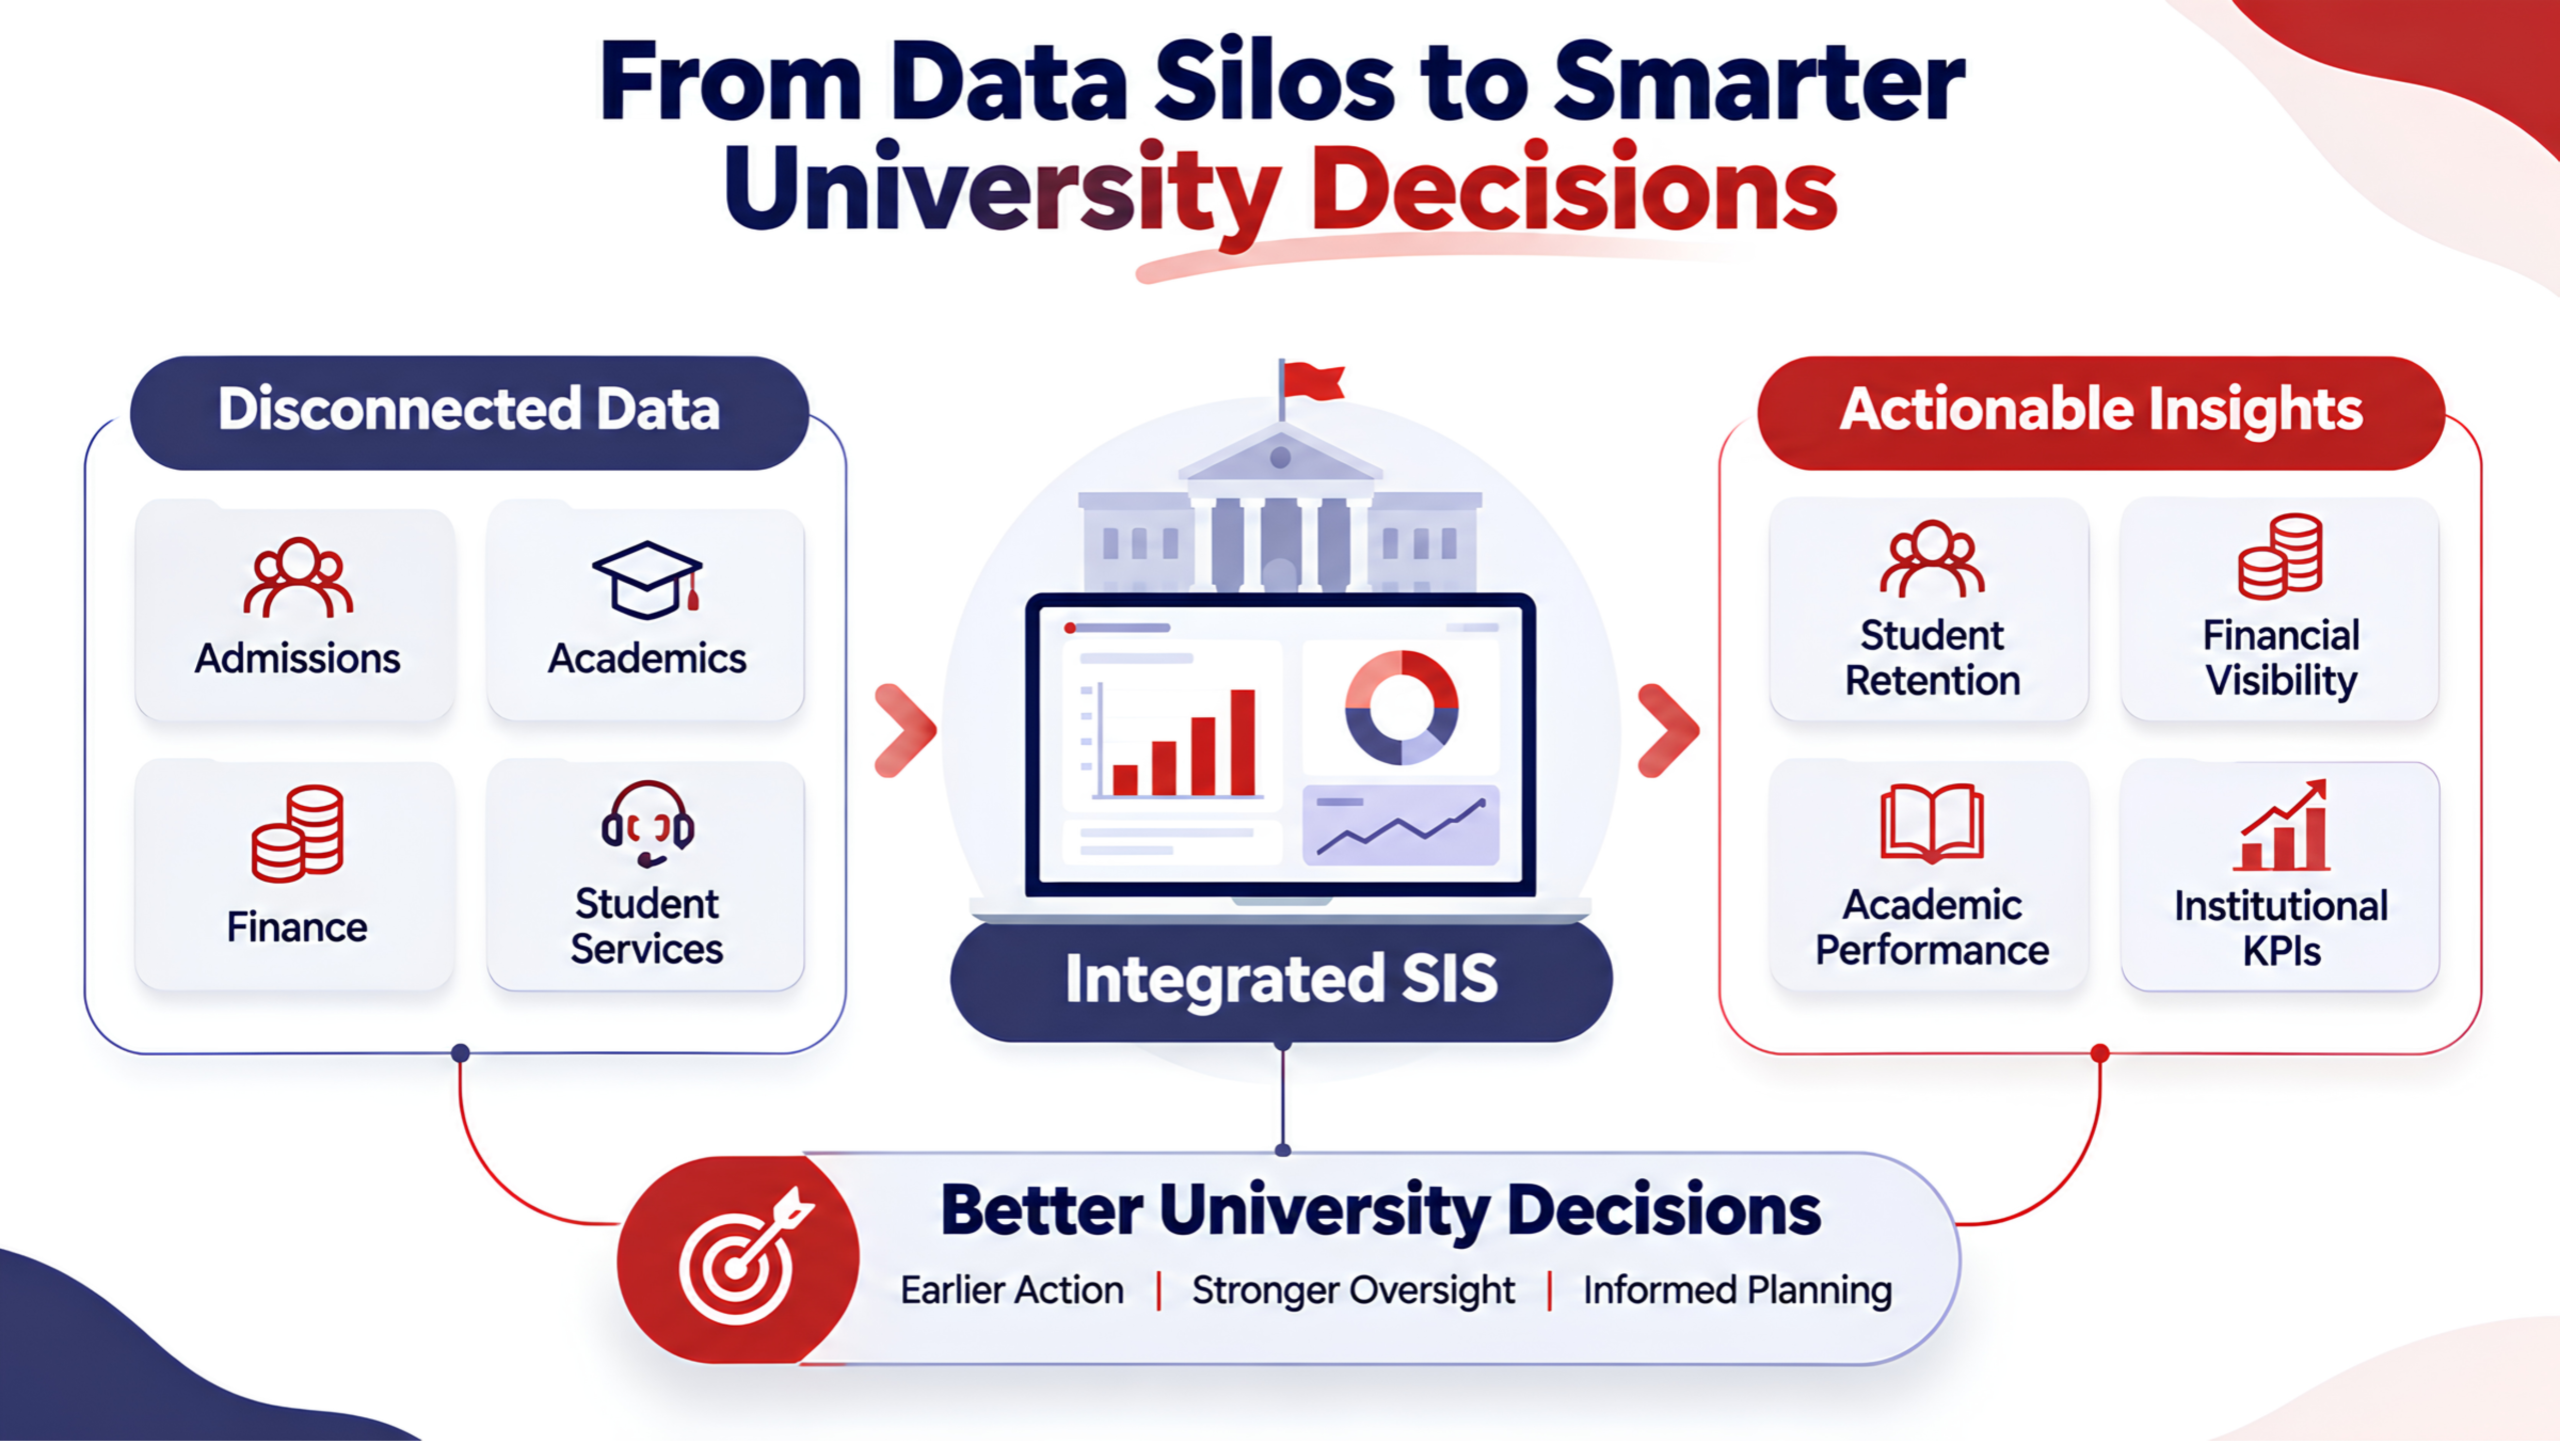
Drawing on our experience in higher education technology, Academia by Serosoft emphasises the importance of a connected reporting environment that brings institutional information together while maintaining appropriate access controls. Universities should prioritise standardised KPIs, role-based dashboards and the ability to drill down from institutional indicators to underlying records. Where reliable historical data is available, trend analysis and predictive capabilities can further support the identification of emerging concerns. This approach helps shorten the distance between identifying a performance gap, understanding its cause, and deciding what to do next.
A modern Student Information System connects information across the student lifecycle:
Admissions → Enrolment → Fees → Academics → Attendance → Examinations → Student Services → Graduation
When these stages are supported by connected institutional information, authorised teams can work with a more consistent view of student and academic records. This reduces the need to repeatedly gather and reconcile information from separate departmental sources.
The Ashoka Education Foundation case study illustrates how digital workflows can improve institutional operations. Through its implementation of Academia, the institution reported:
These are operational automation outcomes reported in the case study, rather than direct measurements of reporting time. They demonstrate how digitising institutional processes can reduce manual effort and improve the availability of structured information for day-to-day operations.
For universities evaluating an SIS, the important consideration is whether the system can support reliable information flows, consistent reporting, and timely access to the information different teams need.
University reporting should do more than present numbers. It should help leadership understand institutional performance, identify emerging challenges, and make decisions with greater confidence.
With connected student information, structured reporting, and actionable institutional insights, universities can reduce dependence on manual data consolidation and strengthen oversight across academic and administrative functions.
Discover how Academia by Serosoft can support connected institutional information and more informed university management. Explore Academia’s solutions.
Key reports include student retention and attrition, academic progression and graduation, programme and course performance, graduate employability and placement, enrolment and admissions conversion, accreditation and quality assurance, fee collection and outstanding receivables, programme-wise financial performance, faculty workload and utilisation, faculty-to-student ratio and academic capacity, institutional KPI and strategic performance, and institutional risk and exception reports.
The exact priorities depend on the university’s strategic goals and reporting requirements.
An SIS helps bring student and institutional information into a more structured environment. This can reduce dependence on disconnected records and manual consolidation, giving authorised decision-makers better visibility into academic, administrative, and financial performance.
An SIS report generally presents specific information for a defined purpose, such as fee collection, attendance, or academic progression. A performance dashboard brings selected indicators together to provide a broader view of institutional performance and progress against key objectives.
Universities can reduce manual reporting by automating recurring reports, standardising data definitions, connecting departmental information, and providing authorised teams with self-service dashboards. Exception-based reporting can also reduce the need to review every record manually.
The review frequency depends on the type of information and the decision it supports. Attendance, fee collections, and admissions may require frequent monitoring, while programme performance, graduation trends, and strategic KPIs may be reviewed monthly, each semester, or annually.
Universities should assess whether an SIS supports accurate and consistent reporting, integration across institutional functions, configurable reports, role-based access, dashboards, and the ability to analyse trends. Reporting should align with institutional goals, regulatory requirements, and data governance policies.

Experience Academia – Your partner in transforming campus operations, a trusted all-in-one ERP/SIS solution.
Get the latest insights, trends, and updates delivered straight to your inbox!